


Trusted by over 15 Million Traders
The Most Awarded Broker
for a Reason
Easy Access to 1,400+ Global Assets
EURUSD
Euro vs U.S. Dollar
US500
S&P 500 (US500)
GOLD
Gold
COFFEE
US Coffee
Apple
Apple (AAPL.OQ)
-

Finance Magnates 颁发
-

Finance Magnates 颁发
-

Capital Finance International Magazine (CFI.co) 2024年颁赠
-

COLWMA 2024年颁赠
-

荣获World Finance Forex Awards 2023最佳外汇客户服务奖
-

荣获World Finance Forex Awards 2023欧洲最佳外汇经纪商奖
-

荣获World Finance Forex Awards 2023澳大拉西亚最佳外汇经纪商奖
-

荣获World Finance Forex Awards 2023拉丁美洲最佳外汇经纪商奖
-

荣获World Finance Forex Awards 2023中东最佳外汇经纪商奖
-

CFI.co于2023年颁赠
-

荣获2023年City of London Wealth Management Awards
-

荣获2022年埃及金融博览会颁赠
-

荣获2022年City of London Wealth Management Awards
-

CFI.co于2022年颁赠
-

荣获Global Forex Awards 2022 — 零售外汇 颁赠
-
2021年迪拜外汇博览会获颁赠
-

Ultimate Fintech 2021年颁赠
-

荣获2021年City of London Wealth Management Awards
-

FX168于2020年12月颁赠
-

荣获Global Business Awards 2020
-

荣获2020年City of London Wealth Management Awards
-

Capital Finance International Magazine (CFI.co)颁赠
-

Capital Finance International Magazine (CFI.co)颁赠
-

荣获2019年City of London Wealth Management Awards
-

Shares Magazine 授予 UK Forex Awards 2018
-

Capital Finance International Magazine (CFI.co)颁赠
-

Capital Finance International Magazine (CFI.co)颁赠
-

2017年伦敦财富管理奖
-

2016最佳本土 客户服务
-

中东和北非地区(MENA)增长最快的经纪商
-
2015年最佳外汇科技提供商
-
2014年最佳外汇科技提供商
-

2014年最佳外汇科技提供商
-

荣获 The Trading Show 2024年非洲 Africa Fintech 峰会颁赠
-

荣获2024年中东地区 Brokersview 颁赠
-
荣获2024年中东地区 Brokersview 颁赠
-

荣获2024年阿曼 Smart Vision 峰会颁赠
-

荣获2024年迪拜外汇博览会颁赠
-

荣获2024年迪拜 Forex Traders Summit 颁赠
-

2024年埃及 Smart Vision 峰会颁赠
-

投查查于2024年颁赠
-

Capital Finance International Magazine (CFI.co) 2024年颁赠
-

CFI.co于2023年颁赠
-

CFI.co于2023年颁赠
-

交易社区平台FOLLOWME于2022年颁赠
-
2022年迪拜Forex Expo获颁赠
-
2022年迪拜Forex Expo获颁赠
-

荣获Global Forex Awards 2022 — 零售外汇 颁赠
-

CFI.co于2022年颁赠
-

CFI.co于2022年颁赠
-

World Finance Forex Awards 2022 颁发
-

World Finance Forex Awards 2022 颁发
-

World Finance Forex Awards 2022 颁发
-

World Finance Forex Awards 2022 颁发
-
交易社区平台FOLLOWME于2021年颁赠
-

2021年埃及Smart Vision Investment Expo博览会获颁赠
-

CFI.co于2021年颁赠
-

CFI.co于2021年颁赠
-

荣获Global Forex Awards 2021 — 零售外汇 颁赠
-

荣获Global Forex Awards 2021 — 零售外汇 颁赠
-

World Finance 2021颁发
-

World Finance 2021颁发
-
FOLLOWME于2021年颁赠
-

Global Forex Awards 2021 — B2B 颁赠
-

Global Forex Awards颁赠
-

Global Forex Awards颁赠
-

CFI.co于2020年颁赠
-

CFI.co于2020年颁赠
-

荣获Global Business Awards 2020
-

World Finance Magazine 颁赠
World Finance Forex Awards 2020 -

World Finance Magazine 颁赠
World Finance Forex Awards 2020 -
FOLLOWME交易社区授予
-

Global Forex Awards颁赠
-

Global Forex Awards颁赠
-

FinTech Age Awards颁发
-

World Finance Magazine 颁赠
World Finance Forex Awards 2019 -

World Finance Magazine 颁赠
World Finance Forex Awards 2019 -

荣获 World Finance Forex Awards 2018 颁赠
-

荣获2018年埃及金融博览会颁赠
-

荣获 Shares Magazine 的 UK Forex Awards 2017 颁赠
-

荣获 World Finance Forex Awards 2017
-

2016年最佳黄金经纪商
-

2016年最佳外汇经纪商
-

2015年最佳本地客户服务
-

Global Brands Magazine 颁赠
-

Online Money Awards 2022 颁发
-

荣获2022年埃及金融博览会颁赠
-

2015最佳外汇交易平台
-

2015最佳金融交易平台
-

2013最佳创新外汇平台奖
-

2020年 Cyprus HR Awards 颁赠
-

金融行业的佼佼者
-

认证最优金牌级别
-

2014年首届亚军
-
Finance Magnates 颁发
-
Finance Magnates 颁发
-
Capital Finance International Magazine (CFI.co) 2024年颁赠
-
COLWMA 2024年颁赠
-
荣获World Finance Forex Awards 2023最佳外汇客户服务奖
-
荣获World Finance Forex Awards 2023欧洲最佳外汇经纪商奖
-
荣获World Finance Forex Awards 2023澳大拉西亚最佳外汇经纪商奖
-
荣获World Finance Forex Awards 2023拉丁美洲最佳外汇经纪商奖
-
荣获World Finance Forex Awards 2023中东最佳外汇经纪商奖
-
CFI.co于2023年颁赠
-
荣获2023年City of London Wealth Management Awards
-
荣获2022年埃及金融博览会颁赠
-
荣获2022年City of London Wealth Management Awards
-
CFI.co于2022年颁赠
-
荣获Global Forex Awards 2022 — 零售外汇 颁赠
-
2021年迪拜外汇博览会获颁赠
-
Ultimate Fintech 2021年颁赠
-
荣获2021年City of London Wealth Management Awards
-
FX168于2020年12月颁赠
-
荣获Global Business Awards 2020
-
荣获2020年City of London Wealth Management Awards
-
Capital Finance International Magazine (CFI.co)颁赠
-
Capital Finance International Magazine (CFI.co)颁赠
-
荣获2019年City of London Wealth Management Awards
-
Shares Magazine 授予 UK Forex Awards 2018
-
Capital Finance International Magazine (CFI.co)颁赠
-
Capital Finance International Magazine (CFI.co)颁赠
-
2017年伦敦财富管理奖
-
2016最佳本土 客户服务
-
中东和北非地区(MENA)增长最快的经纪商
-
2015年最佳外汇科技提供商
-
2014年最佳外汇科技提供商
-
2014年最佳外汇科技提供商
-
荣获 The Trading Show 2024年非洲 Africa Fintech 峰会颁赠
-
荣获2024年中东地区 Brokersview 颁赠
-
荣获2024年中东地区 Brokersview 颁赠
-
荣获2024年阿曼 Smart Vision 峰会颁赠
-
荣获2024年迪拜外汇博览会颁赠
-
荣获2024年迪拜 Forex Traders Summit 颁赠
-
2024年埃及 Smart Vision 峰会颁赠
-
投查查于2024年颁赠
-
Capital Finance International Magazine (CFI.co) 2024年颁赠
-
CFI.co于2023年颁赠
-
CFI.co于2023年颁赠
-
交易社区平台FOLLOWME于2022年颁赠
-
2022年迪拜Forex Expo获颁赠
-
2022年迪拜Forex Expo获颁赠
-
荣获Global Forex Awards 2022 — 零售外汇 颁赠
-
CFI.co于2022年颁赠
-
CFI.co于2022年颁赠
-
World Finance Forex Awards 2022 颁发
-
World Finance Forex Awards 2022 颁发
-
World Finance Forex Awards 2022 颁发
-
World Finance Forex Awards 2022 颁发
-
交易社区平台FOLLOWME于2021年颁赠
-
2021年埃及Smart Vision Investment Expo博览会获颁赠
-
CFI.co于2021年颁赠
-
CFI.co于2021年颁赠
-
荣获Global Forex Awards 2021 — 零售外汇 颁赠
-
荣获Global Forex Awards 2021 — 零售外汇 颁赠
-
World Finance 2021颁发
-
World Finance 2021颁发
-
FOLLOWME于2021年颁赠
-
Global Forex Awards 2021 — B2B 颁赠
-
Global Forex Awards颁赠
-
Global Forex Awards颁赠
-
CFI.co于2020年颁赠
-
CFI.co于2020年颁赠
-
荣获Global Business Awards 2020
-
World Finance Magazine 颁赠
World Finance Forex Awards 2020 -
World Finance Magazine 颁赠
World Finance Forex Awards 2020 -
FOLLOWME交易社区授予
-
Global Forex Awards颁赠
-
Global Forex Awards颁赠
-
FinTech Age Awards颁发
-
World Finance Magazine 颁赠
World Finance Forex Awards 2019 -
World Finance Magazine 颁赠
World Finance Forex Awards 2019 -
荣获 World Finance Forex Awards 2018 颁赠
-
荣获2018年埃及金融博览会颁赠
-
荣获 Shares Magazine 的 UK Forex Awards 2017 颁赠
-
荣获 World Finance Forex Awards 2017
-
2016年最佳黄金经纪商
-
2016年最佳外汇经纪商
-
2015年最佳本地客户服务
-
Global Brands Magazine 颁赠
-
Online Money Awards 2022 颁发
-
荣获2022年埃及金融博览会颁赠
-
2015最佳外汇交易平台
-
2015最佳金融交易平台
-
2013最佳创新外汇平台奖
-
2020年 Cyprus HR Awards 颁赠
-
金融行业的佼佼者
-
认证最优金牌级别
-
2014年首届亚军

Awarded BestBrokerYear After Year
CATEGORIES
News
- 7.22 How far can gold go when it is strongly upward?
- The gold bulls had no power to fight back and continued to be short in the early
- The ultimate game between Fed's interest rate cut expectations and inflation dat
- Rate cut expectations undermine the US index, gold and silver profits delay lowe
- Chinese live lecture today's preview
market news
Gold's high last Friday decided whether it could continue, and the short-term range of Europe and the United States
Wonderful introduction:
Optimism is the line of egrets that are straight up to the blue sky, optimism is the ten thousand white sails beside the sunken boat, optimism is the lush grass that blows with the wind on the head of the parrot island, optimism is the falling red spots that turn into spring mud to protect the flowers.
Hello everyone, today XM Foreign Exchange will bring you "[XM Foreign Exchange Official Website]: Gold's high last Friday will be determined whether it can continue, and the short-term treatment of Europe and the United States." Hope it will be helpful to you! The original content is as follows:
Dollar Index
In terms of the performance of the US dollar index, the US dollar index showed a downward trend last Friday. The price of the US dollar index rose to 98.81 on the day, and fell to 97.529 at the lowest, and finally closed at 97.697. Looking back on the market performance last Friday, during the early trading session, the price rose in the short term at the low point of the retreat in the early morning of the previous day, and then hit a high point of the day and was under pressure again. After the opening of the European session, the price continued to be suppressed, and the US session was affected by Powell's speech and prices fell rapidly and finally closed at a low level.
From a multi-cycle analysis, the weekly level has recently been supported by the weekly support up and down. This week, the focus is on the 98.10 position to stabilize. Once it stands firm, the medium-term bulls will continue to rise. At the daily level, on the daily line, gold prices are currently fluctuating at low levels. Although the current price is below the daily resistance, the overall price still needs to pay attention to the gains and losses of the daily resistance position of 98.10, and the price still needs to pay attention to the performance of standing firm in the future. From the four-hour perspective, the four-hour trend is the key to our emphasis on short-term price trends. Currently, the four-hour resistance is in the 98.20 area. The price should be cautious before it stabilizes in this position, and then pay attention to further continuation after it stabilizes in the future. From an hourly perspective, the market has shown further upward performance after the sharp decline last Friday, so be cautious about the US dollar index's short orders and focus on the performance of further increase in the future.
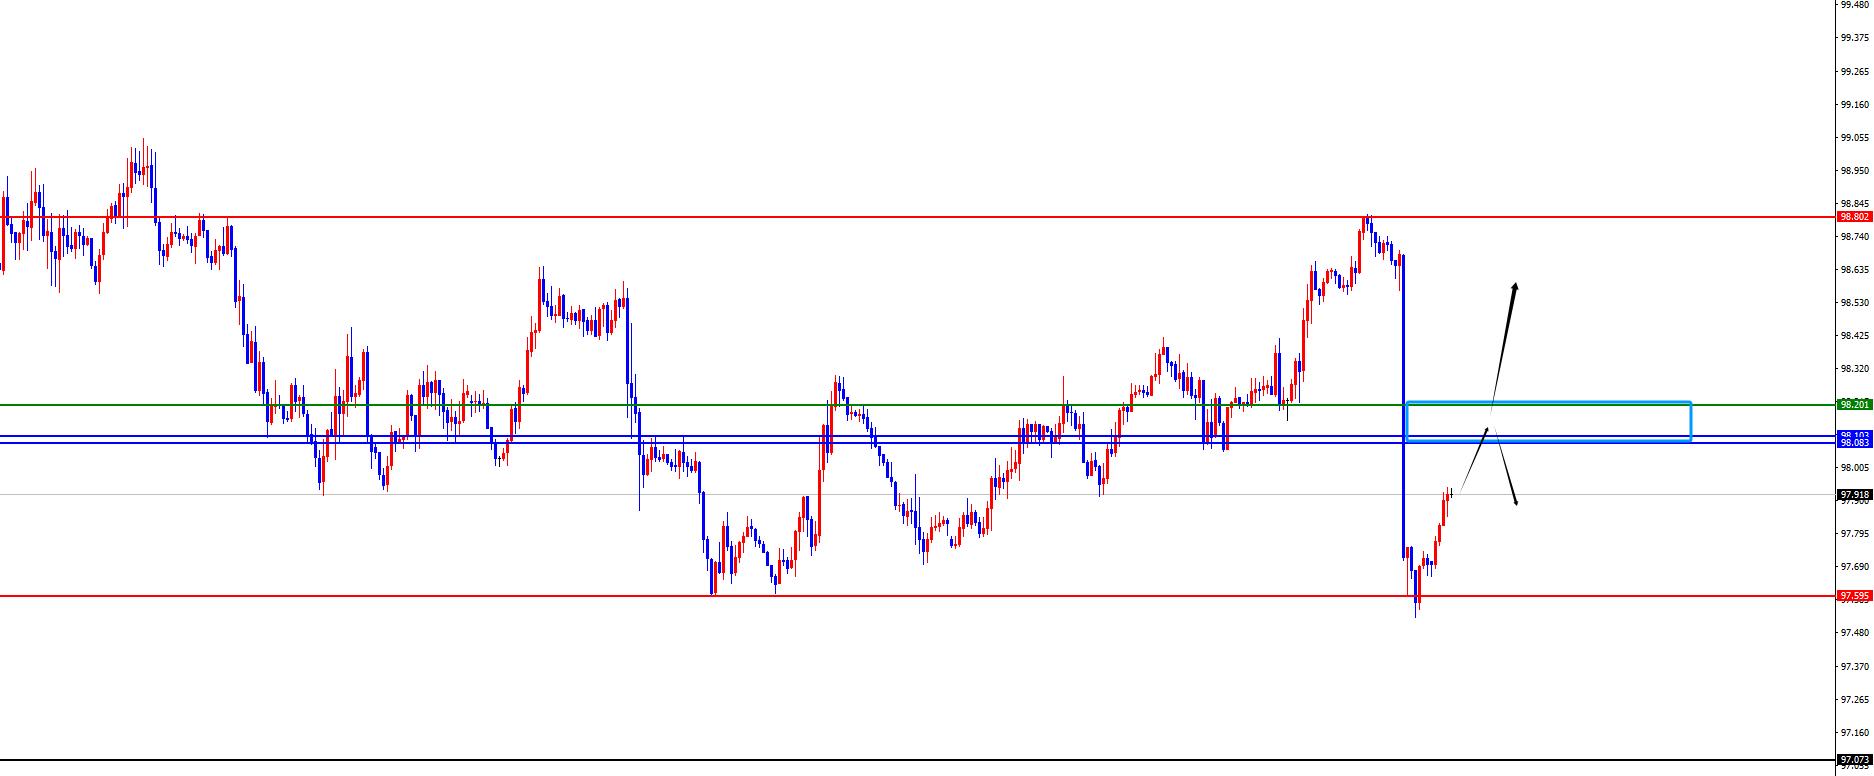
The US dollar index 98.10-20 is the watershed of long and short
Gold
GoldLast Friday, gold prices generally showed an upward trend. The price rose to 3378.7 on the day, and fell to 3321.33 at the lowest, closing at 3371.7 at the end. In response to the pressure and decline in gold prices in the early trading last Friday, and the European market was also under pressure, but after the US price bottomed out and rebounded, mainly due to Powell's speech, the price was tested upward to near the downward trend line, and finally the daily line ended with a big positive. For the current situation, gold is still in the triangular fluctuation and contraction range. The short-term gains and losses of the high points on Friday last Friday determine whether it can rise and fall.
From multi-cycle analysis, first observe the monthly rhythm, the price has continued to fluctuate at high levels in recent months, so bulls need to be cautious before breaking through the previous high. Currently, the long and short watershed of the monthly line is at 2920. In the short term, the gains and losses of the high and low points of the last month have become the key. From the weekly level, the price on the weekly line has been fluctuating in two negative and two positive fluctuations, but the final closing of the market last week did not close, so we need to pay attention to the performance of the subsequent rhythm. At present, the weekly watershed is at 3350, and the price will only turn short if it closes below this position. From the daily level, the price is currently operating in the triangle oscillation and contraction range. At present, the contraction range is focused on the 3410-3315 range, and the price will only continue after breaking through the range. The current position of 3353 is the watershed of the band trend. From the four-hour perspective, we need to pay attention to the 3350 regional watershed, which is the watershed of short-term trends. On the one-hour basis, the price needs to be adjusted after a sharp rise last Friday, so be cautious to catch up with long before breaking through last Friday's high, focusing on the gains and losses of the multi-cycle resonance support range of 3350-3353.
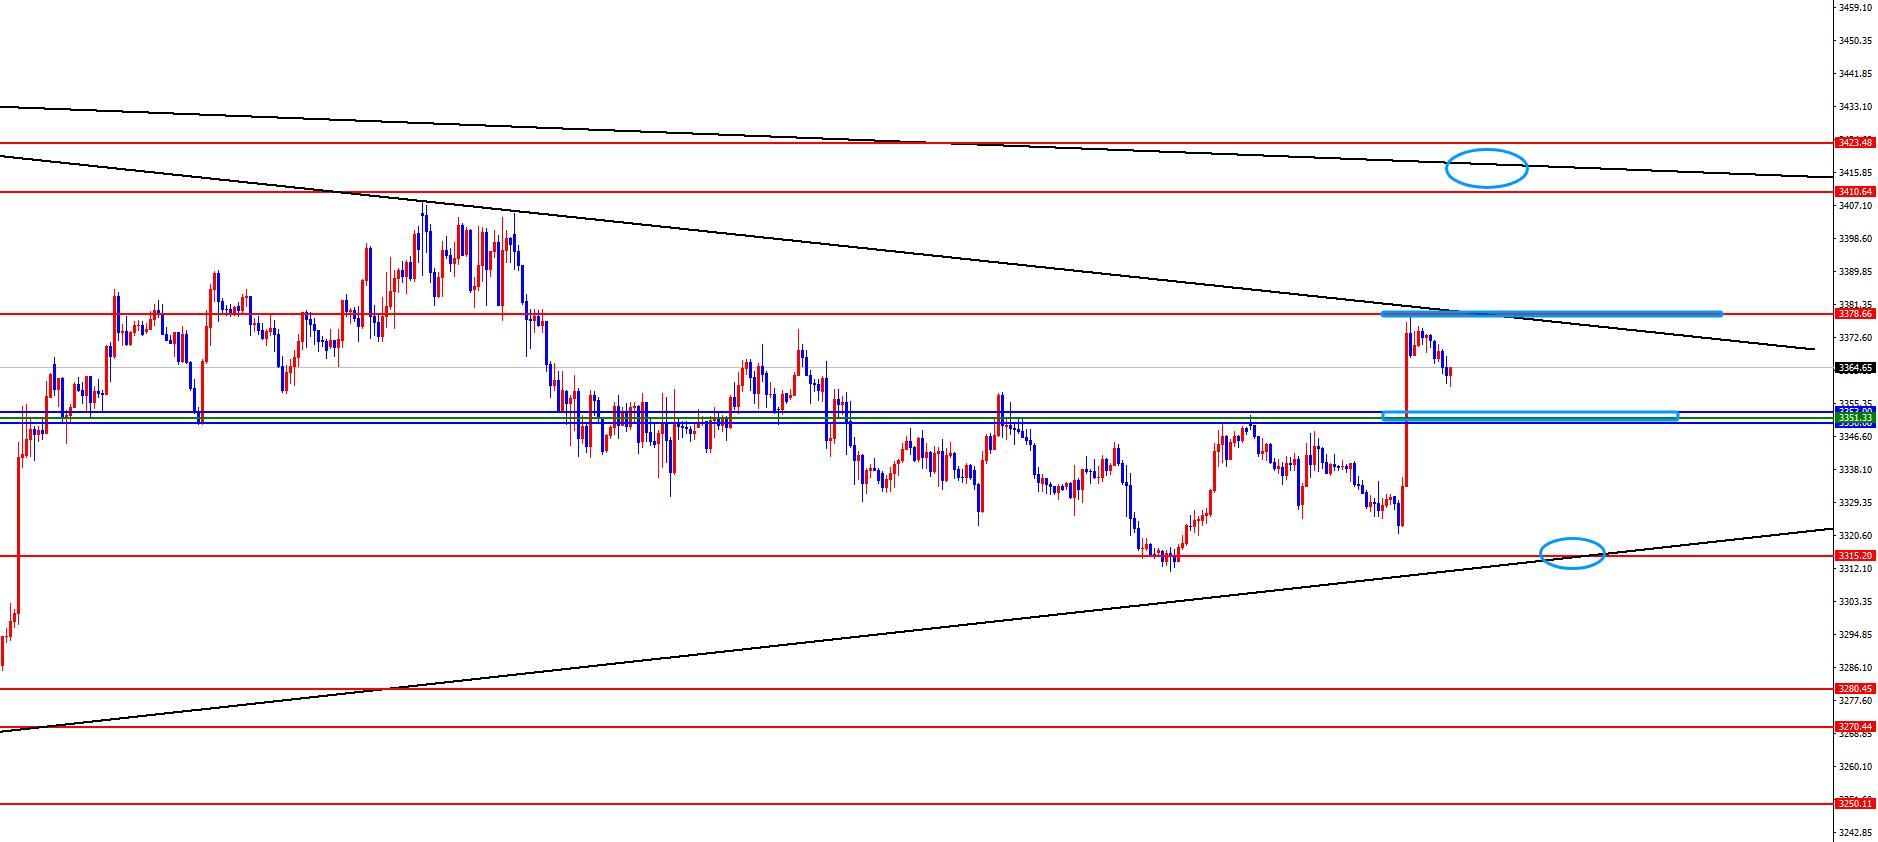
Gold is generally concerned about the 3315-3410 range, and the short-term focus is on the 3350-3380 range
Europe and the United States
Europe and the United States
Europe and the United States
Europe and the United States
Europe and the United States
Europe and the United States
Europe and the United States
Europe and the United States
Europe and the United States
Europe and the United States
Europe and the United States
Europe and the United States
Europe and the United States
Europe and the United States
Europe and the United States
Europe and the United States
Europe and the United States
Europe and the United States
Europe and the United States
Europe and the United States
Europe and the United States
Europe and the United States
Europe and the United States
Europe and the United States
Europe and the United States
Europe and the United States
Europe and the United States
Europe and the United States
Europe and the United States
Europe and the United States
Europe and the United States
Europe and the United States
Europe and the United States
Europe and the United States
Europe and the United States
The price fell to 1.1582 on the day and rose to 1.1742 on the spot and closed at 1.1720 on the spot. Looking back at the performance of European and American markets last Friday, prices fluctuated in the short term and then fell under pressure. Then they rose after hitting the low point of the week. After the U.S. price rose sharply and finally ended with a big positive.
From a multi-cycle analysis, from the perspective of the monthly line level, Europe and the United States are supported at 1.0950, so long-term bulls are treated, and the monthly line ends with a large negative end. Therefore, when you are bullish, you need to pay attention to market adjustments. From the weekly level, the price is supported by the 1.1620 area, which is the long-shoulder watershed in the mid-line trend. From the daily level, the daily line is currently supported at the 1.1660 position over time, which serves as a key watershed in the band trend. According to the four-hour level, the current four-hour resistance is in the 1.1650 area, and the price is more xmhouses.commonly treated above this position. At the same time, the high point on Friday happened to be the downward trend line resistance of the current short-term trend. You need to pay attention to this position in the future.Put gains and losses. After the price has continued to rise last Friday, the price has been revised. Therefore, before the high point on Friday has not exceeded, focus on the pressure correction, and focus on the daily line and four-hour support gains and losses below. Conservatives can wait for the breaking range before following.
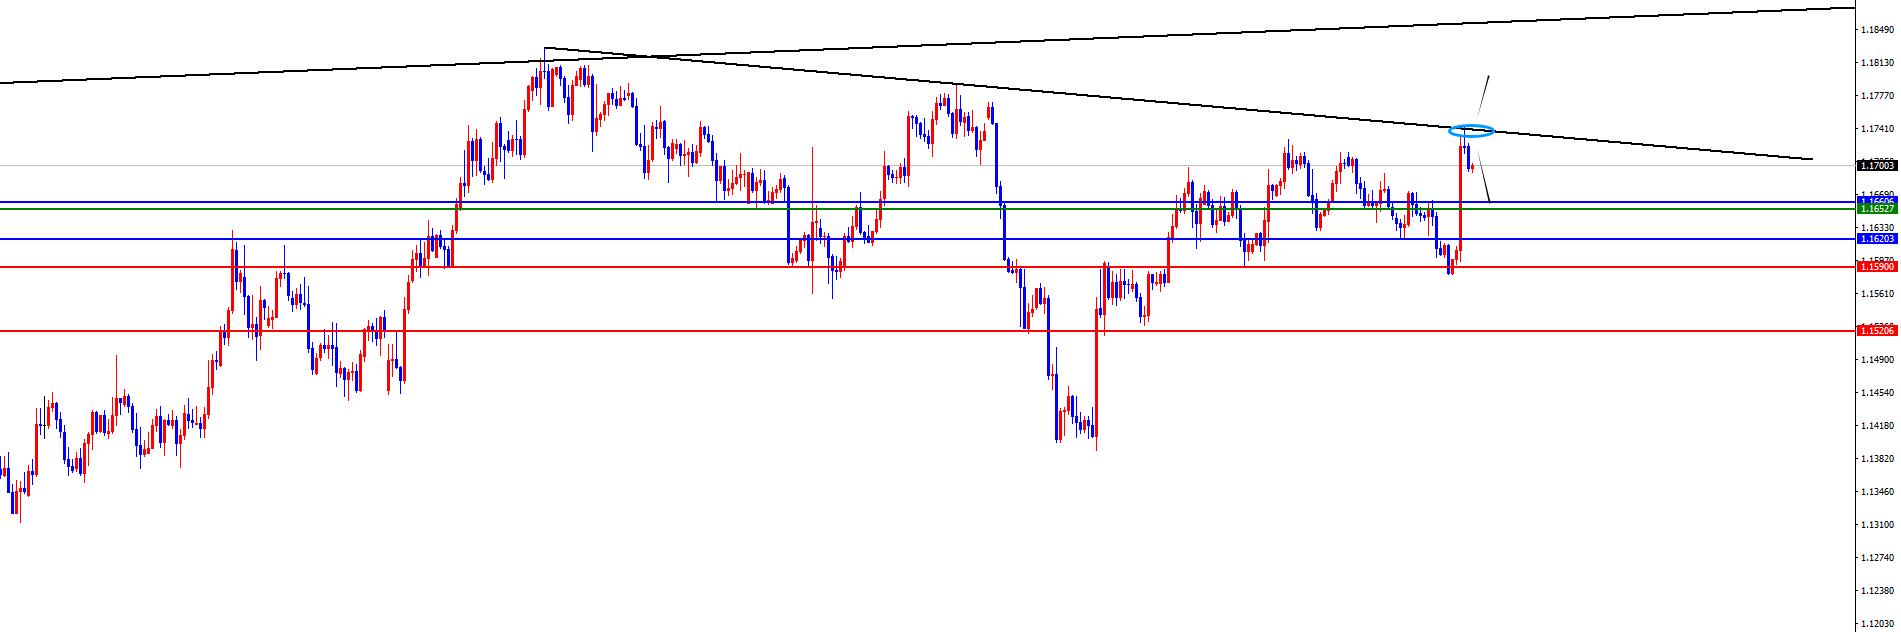
Europe and the United States pay attention to the range of 1.1660-1.1740, and follow after breaking the level
[Finance data and events that are focused today] Monday, August 25, 2025
①16:00 Germany's August IFO Business Fed Index
②22:00 The total number of new home sales in the United States in July was annualized
③22:30 US Dallas Fed Business Activity Index in August
④The next day, the Federal Reserve Logan delivered a speech
Note: The above is only personal opinions and strategies, for reference and xmhouses.communication only, and does not give customers any investment advice. It has nothing to do with customers' investment, and is not used as a basis for ordering.
The above content is all about "[XM Forex Official Website]: Gold's high last Friday decided whether it can continue, and the treatment of short-term ranges in Europe and the United States" is carefully xmhouses.compiled and edited by the editor of XM Forex. I hope it will be helpful to your trading! Thanks for the support!
After doing something, there will always be experience and lessons. In order to facilitate future work, we must analyze, study, summarize and concentrate the experience and lessons of previous work, and raise it to the theoretical level to understand it.
Disclaimers: XM Group only provides execution services and access permissions for online trading platforms, and allows individuals to view and/or use the website or the content provided on the website, but has no intention of making any changes or extensions, nor will it change or extend its services and access permissions. All access and usage permissions will be subject to the following terms and conditions: (i) Terms and conditions; (ii) Risk warning; And (iii) a complete disclaimer. Please note that all information provided on the website is for general informational purposes only. In addition, the content of all XM online trading platforms does not constitute, and cannot be used for any unauthorized financial market trading invitations and/or invitations. Financial market transactions pose significant risks to your investment capital.
All materials published on online trading platforms are only intended for educational/informational purposes and do not include or should be considered for financial, investment tax, or trading related consulting and advice, or transaction price records, or any financial product or non invitation related trading offers or invitations.
All content provided by XM and third-party suppliers on this website, including opinions, news, research, analysis, prices, other information, and third-party website links, remains unchanged and is provided as general market commentary rather than investment advice. All materials published on online trading platforms are only for educational/informational purposes and do not include or should be considered as applicable to financial, investment tax, or trading related advice and recommendations, or transaction price records, or any financial product or non invitation related financial offers or invitations. Please ensure that you have read and fully understood the information on XM's non independent investment research tips and risk warnings. For more details, please click here