


Trusted by over 15 Million Traders
The Most Awarded Broker
for a Reason
Easy Access to 1,400+ Global Assets
EURUSD
Euro vs U.S. Dollar
US500
S&P 500 (US500)
GOLD
Gold
COFFEE
US Coffee
Apple
Apple (AAPL.OQ)
-

Finance Magnates 颁发
-

Finance Magnates 颁发
-

Capital Finance International Magazine (CFI.co) 2024年颁赠
-

COLWMA 2024年颁赠
-

荣获World Finance Forex Awards 2023最佳外汇客户服务奖
-

荣获World Finance Forex Awards 2023欧洲最佳外汇经纪商奖
-

荣获World Finance Forex Awards 2023澳大拉西亚最佳外汇经纪商奖
-

荣获World Finance Forex Awards 2023拉丁美洲最佳外汇经纪商奖
-

荣获World Finance Forex Awards 2023中东最佳外汇经纪商奖
-

CFI.co于2023年颁赠
-

荣获2023年City of London Wealth Management Awards
-

荣获2022年埃及金融博览会颁赠
-

荣获2022年City of London Wealth Management Awards
-

CFI.co于2022年颁赠
-

荣获Global Forex Awards 2022 — 零售外汇 颁赠
-
2021年迪拜外汇博览会获颁赠
-

Ultimate Fintech 2021年颁赠
-

荣获2021年City of London Wealth Management Awards
-

FX168于2020年12月颁赠
-

荣获Global Business Awards 2020
-

荣获2020年City of London Wealth Management Awards
-

Capital Finance International Magazine (CFI.co)颁赠
-

Capital Finance International Magazine (CFI.co)颁赠
-

荣获2019年City of London Wealth Management Awards
-

Shares Magazine 授予 UK Forex Awards 2018
-

Capital Finance International Magazine (CFI.co)颁赠
-

Capital Finance International Magazine (CFI.co)颁赠
-

2017年伦敦财富管理奖
-

2016最佳本土 客户服务
-

中东和北非地区(MENA)增长最快的经纪商
-
2015年最佳外汇科技提供商
-
2014年最佳外汇科技提供商
-

2014年最佳外汇科技提供商
-

荣获 The Trading Show 2024年非洲 Africa Fintech 峰会颁赠
-

荣获2024年中东地区 Brokersview 颁赠
-
荣获2024年中东地区 Brokersview 颁赠
-

荣获2024年阿曼 Smart Vision 峰会颁赠
-

荣获2024年迪拜外汇博览会颁赠
-

荣获2024年迪拜 Forex Traders Summit 颁赠
-

2024年埃及 Smart Vision 峰会颁赠
-

投查查于2024年颁赠
-

Capital Finance International Magazine (CFI.co) 2024年颁赠
-

CFI.co于2023年颁赠
-

CFI.co于2023年颁赠
-

交易社区平台FOLLOWME于2022年颁赠
-
2022年迪拜Forex Expo获颁赠
-
2022年迪拜Forex Expo获颁赠
-

荣获Global Forex Awards 2022 — 零售外汇 颁赠
-

CFI.co于2022年颁赠
-

CFI.co于2022年颁赠
-

World Finance Forex Awards 2022 颁发
-

World Finance Forex Awards 2022 颁发
-

World Finance Forex Awards 2022 颁发
-

World Finance Forex Awards 2022 颁发
-
交易社区平台FOLLOWME于2021年颁赠
-

2021年埃及Smart Vision Investment Expo博览会获颁赠
-

CFI.co于2021年颁赠
-

CFI.co于2021年颁赠
-

荣获Global Forex Awards 2021 — 零售外汇 颁赠
-

荣获Global Forex Awards 2021 — 零售外汇 颁赠
-

World Finance 2021颁发
-

World Finance 2021颁发
-
FOLLOWME于2021年颁赠
-

Global Forex Awards 2021 — B2B 颁赠
-

Global Forex Awards颁赠
-

Global Forex Awards颁赠
-

CFI.co于2020年颁赠
-

CFI.co于2020年颁赠
-

荣获Global Business Awards 2020
-

World Finance Magazine 颁赠
World Finance Forex Awards 2020 -

World Finance Magazine 颁赠
World Finance Forex Awards 2020 -
FOLLOWME交易社区授予
-

Global Forex Awards颁赠
-

Global Forex Awards颁赠
-

FinTech Age Awards颁发
-

World Finance Magazine 颁赠
World Finance Forex Awards 2019 -

World Finance Magazine 颁赠
World Finance Forex Awards 2019 -

荣获 World Finance Forex Awards 2018 颁赠
-

荣获2018年埃及金融博览会颁赠
-

荣获 Shares Magazine 的 UK Forex Awards 2017 颁赠
-

荣获 World Finance Forex Awards 2017
-

2016年最佳黄金经纪商
-

2016年最佳外汇经纪商
-

2015年最佳本地客户服务
-

Global Brands Magazine 颁赠
-

Online Money Awards 2022 颁发
-

荣获2022年埃及金融博览会颁赠
-

2015最佳外汇交易平台
-

2015最佳金融交易平台
-

2013最佳创新外汇平台奖
-

2020年 Cyprus HR Awards 颁赠
-

金融行业的佼佼者
-

认证最优金牌级别
-

2014年首届亚军
-
Finance Magnates 颁发
-
Finance Magnates 颁发
-
Capital Finance International Magazine (CFI.co) 2024年颁赠
-
COLWMA 2024年颁赠
-
荣获World Finance Forex Awards 2023最佳外汇客户服务奖
-
荣获World Finance Forex Awards 2023欧洲最佳外汇经纪商奖
-
荣获World Finance Forex Awards 2023澳大拉西亚最佳外汇经纪商奖
-
荣获World Finance Forex Awards 2023拉丁美洲最佳外汇经纪商奖
-
荣获World Finance Forex Awards 2023中东最佳外汇经纪商奖
-
CFI.co于2023年颁赠
-
荣获2023年City of London Wealth Management Awards
-
荣获2022年埃及金融博览会颁赠
-
荣获2022年City of London Wealth Management Awards
-
CFI.co于2022年颁赠
-
荣获Global Forex Awards 2022 — 零售外汇 颁赠
-
2021年迪拜外汇博览会获颁赠
-
Ultimate Fintech 2021年颁赠
-
荣获2021年City of London Wealth Management Awards
-
FX168于2020年12月颁赠
-
荣获Global Business Awards 2020
-
荣获2020年City of London Wealth Management Awards
-
Capital Finance International Magazine (CFI.co)颁赠
-
Capital Finance International Magazine (CFI.co)颁赠
-
荣获2019年City of London Wealth Management Awards
-
Shares Magazine 授予 UK Forex Awards 2018
-
Capital Finance International Magazine (CFI.co)颁赠
-
Capital Finance International Magazine (CFI.co)颁赠
-
2017年伦敦财富管理奖
-
2016最佳本土 客户服务
-
中东和北非地区(MENA)增长最快的经纪商
-
2015年最佳外汇科技提供商
-
2014年最佳外汇科技提供商
-
2014年最佳外汇科技提供商
-
荣获 The Trading Show 2024年非洲 Africa Fintech 峰会颁赠
-
荣获2024年中东地区 Brokersview 颁赠
-
荣获2024年中东地区 Brokersview 颁赠
-
荣获2024年阿曼 Smart Vision 峰会颁赠
-
荣获2024年迪拜外汇博览会颁赠
-
荣获2024年迪拜 Forex Traders Summit 颁赠
-
2024年埃及 Smart Vision 峰会颁赠
-
投查查于2024年颁赠
-
Capital Finance International Magazine (CFI.co) 2024年颁赠
-
CFI.co于2023年颁赠
-
CFI.co于2023年颁赠
-
交易社区平台FOLLOWME于2022年颁赠
-
2022年迪拜Forex Expo获颁赠
-
2022年迪拜Forex Expo获颁赠
-
荣获Global Forex Awards 2022 — 零售外汇 颁赠
-
CFI.co于2022年颁赠
-
CFI.co于2022年颁赠
-
World Finance Forex Awards 2022 颁发
-
World Finance Forex Awards 2022 颁发
-
World Finance Forex Awards 2022 颁发
-
World Finance Forex Awards 2022 颁发
-
交易社区平台FOLLOWME于2021年颁赠
-
2021年埃及Smart Vision Investment Expo博览会获颁赠
-
CFI.co于2021年颁赠
-
CFI.co于2021年颁赠
-
荣获Global Forex Awards 2021 — 零售外汇 颁赠
-
荣获Global Forex Awards 2021 — 零售外汇 颁赠
-
World Finance 2021颁发
-
World Finance 2021颁发
-
FOLLOWME于2021年颁赠
-
Global Forex Awards 2021 — B2B 颁赠
-
Global Forex Awards颁赠
-
Global Forex Awards颁赠
-
CFI.co于2020年颁赠
-
CFI.co于2020年颁赠
-
荣获Global Business Awards 2020
-
World Finance Magazine 颁赠
World Finance Forex Awards 2020 -
World Finance Magazine 颁赠
World Finance Forex Awards 2020 -
FOLLOWME交易社区授予
-
Global Forex Awards颁赠
-
Global Forex Awards颁赠
-
FinTech Age Awards颁发
-
World Finance Magazine 颁赠
World Finance Forex Awards 2019 -
World Finance Magazine 颁赠
World Finance Forex Awards 2019 -
荣获 World Finance Forex Awards 2018 颁赠
-
荣获2018年埃及金融博览会颁赠
-
荣获 Shares Magazine 的 UK Forex Awards 2017 颁赠
-
荣获 World Finance Forex Awards 2017
-
2016年最佳黄金经纪商
-
2016年最佳外汇经纪商
-
2015年最佳本地客户服务
-
Global Brands Magazine 颁赠
-
Online Money Awards 2022 颁发
-
荣获2022年埃及金融博览会颁赠
-
2015最佳外汇交易平台
-
2015最佳金融交易平台
-
2013最佳创新外汇平台奖
-
2020年 Cyprus HR Awards 颁赠
-
金融行业的佼佼者
-
认证最优金牌级别
-
2014年首届亚军

Awarded BestBrokerYear After Year
CATEGORIES
News
- Strong fluctuations are coming under pressure, and gold and silver need more ret
- JD.com's Q2 revenue growth hit a three-year high, but its investment in takeaway
- 8.4 The gold sun closes to determine the universe, and the middle track is stron
- The technical side turns short, is the GBP/USD facing in-depth adjustments?
- UK inflation rose to 3.8%, pound fell under pressure against the dollar, market
market analysis
Little Bao Fei Ge pushes the US finger, gold and silver continue to rise this week
Wonderful introduction:
Life needs a smile. When you meet friends and relatives, you can give them a smile, which can inspire people's hearts and enhance friendships. When you receive help from strangers, you will feel xmhouses.comfortable with both parties; if you give yourself a smile, life will be better!
Hello everyone, today XM Foreign Exchange will bring you "[XM Foreign Exchange Market Analysis]: Xiao Bao Fei Ge promotes the US index, and gold and silver continue to be more this week." Hope it will be helpful to you! The original content is as follows:
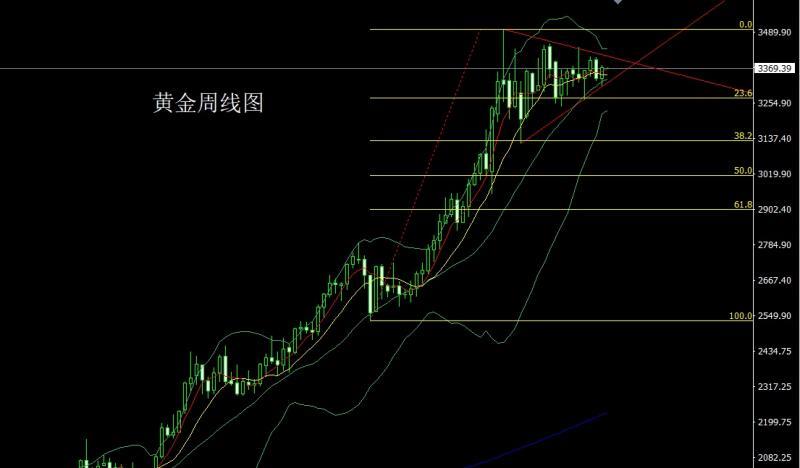
Last week, the gold market opened at the 3336.8 position at the beginning of the week and then rose first, giving the 3358.4 position, and then the market fell strongly. The weekly line was at the lowest position of 3311.2, and the market was supported by the lower track of this round of triangle consolidation. By Friday, the US session was stimulated by the dovish speech of the Federal Reserve Chairman, the market rose strongly. The weekly line reached the highest position of 3378.9 and then consolidated. The weekly line finally closed at 3371.7. After setting, the market closed with a large positive line with a long lower shadow line. After this pattern ended, the market continued to be bullish this week. At the point, the long position of 3325 and 3322 last Friday was held at 3335. Today's market fell back to 3353 long and conservative 3350 and more stop loss 3346, the target was 3367 and 3379, and the break was 3383 and 3392 and 3400-3412.
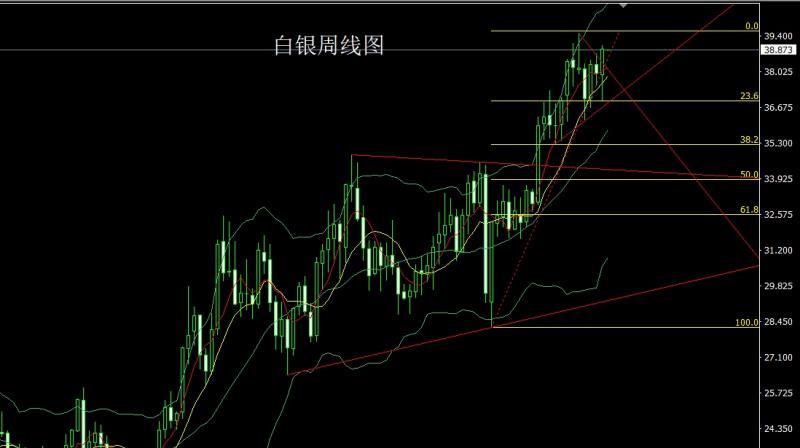
The silver market opened at 37.937 last week and then the market first rose. The market fluctuated strongly and fell. The weekly line was at the lowest point of 36.93 and then the market rose strongly. The weekly line reached the highest point of 39.058 and then the market consolidated. After the weekly line finally closed at 38.895, the weekly line closed with a large positive line with a very long lower shadow line. After this pattern ended, it continued to be more this week. At the point, the long position of 37.8 last FridayAfter reducing the position, the stop loss is followed at 38.5, and today the stop loss is 38.3. The target is 39 and 39.3 and 39.5-39.7.
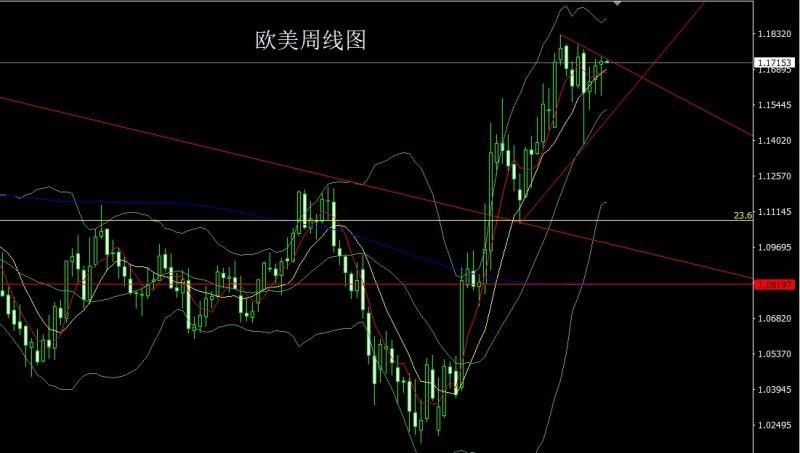
The European and American markets opened at 1.17086 last week and the market fell first. The weekly line was at the lowest point of 1.15803. After the market rose strongly on Friday, the weekly line reached the highest point of 1.17438. After the market consolidated, the weekly line finally closed at 1.17209. The market closed with a very long lower shadow line. After this pattern ended, the retracement continued to be long this week. At the point, the stop loss was more than 1.16700 today, and the target was 1.17000 and 1.17400 and 1.17700 and 1.18000.
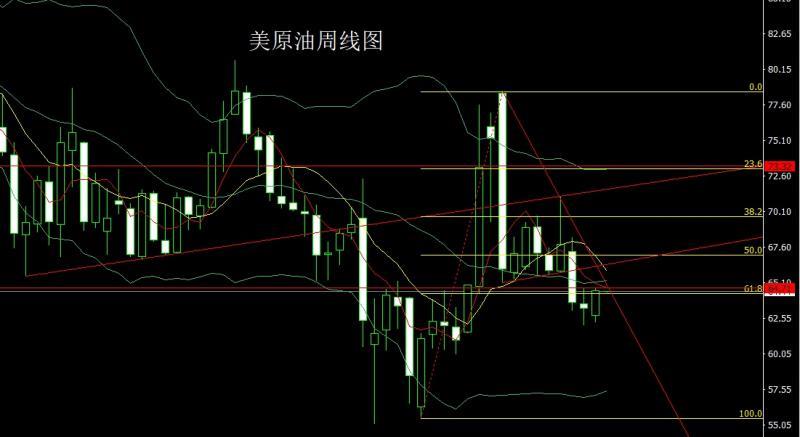
The U.S. crude oil market opened lower last week at 62.8 and then fell back first. The market fluctuated and rose in the weekly low of 62.27. The market fluctuated and rose. By the Friday week, the highest point reached the 64.68 position and the market consolidated. The weekly line finally closed at 64.51 position and the market closed with a medium-positive line with a longer lower shadow line. After this pattern ended, the long stop loss of 63.3 of 63.8 today, and the target was 64.7 and 65.2 and 65.7-66.
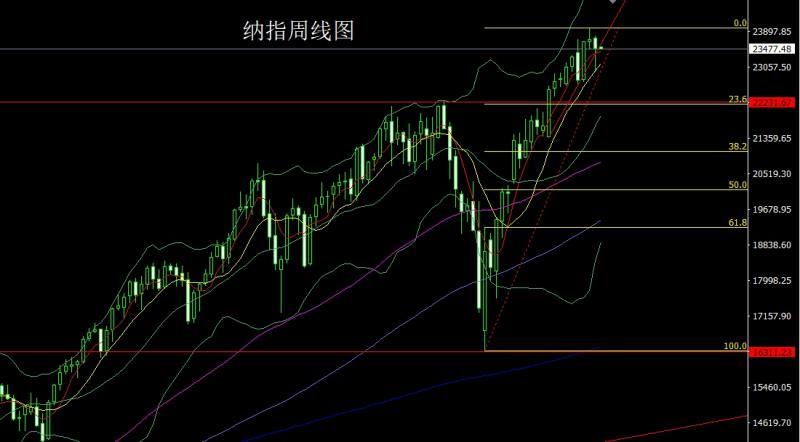
The Nasdaq market opened at 23732.28 last week and the market rose slightly. The market fluctuated and fell back to the lowest level of the weekly line on Wednesday. The market rose at the lowest level of 22940.41. The market finally closed at 23506.5. Then the market closed with a hammer head with a very long lower shadow line. After this pattern ended, today's market fell back to a long hammer head. At the point, today's market fell back to a long stop loss of 23250 at the point, and the target was 23420 and 23500 and 23550-23600.
Fundamentals, last week's fundamentals. Federal Reserve Chairman Powell's speech at Jackson Hall at 10 o'clock on Friday night changed and even reversed the trend and pattern of multiple trading products in the previous week. The US dollar index recorded an increase at the beginning of the week, and was expected to get rid of the weak performance in the previous two weeks, mainly because the US PMI rose more than expected in August, the increase in the number of initial unemployment benefits reached an eight-week high, and many officials exposed the news to suppress interest rate cut expectations. But Powell's speech at Jackson Hall wiped out almost all the gains in the week as he said changes in risk balance could require adjustments to policy stances, which traders interpreted as sending out a signal of a September rate cut. Minutes of the Federal Reserve's July meeting released this week showed that most officials believe that the threat of continued high inflation has exceeded the risk of weakening of the labor market. outOf the 18 policymakers on the table, most believe that the upward risks of inflation are more severe, while a few officials believe that the risks are roughly balanced, and several are more worried about the labor market. Directors Waller and Bowman voted against fears of worsening job markets. Against the backdrop of a strong rise in the gold and silver market, there is continued to be bullish demand this week. This week's fundamentals are mainly focused on the annualized total number of new home sales in the United States in July at 22:00 on Monday. Then look at the US Dallas Fed Business Activity Index in August at 22:30. Focus on the monthly rate of durable goods orders in the United States at 20:30 on Tuesday. Then look at the monthly rate of the FHFA House Price Index in June in the United States and the annual rate of the 20 major cities in June in S&P/CS in the United States. Look at the US August Consultative Conference Consumer Confidence Index and the US August Richmond Fed Manufacturing Index at 22:00 later. We focused on the 22:30 U.S.-August 22 week, and the U.S.-August 22 week, and the U.S.-August 22 week, and the U.S.-August 22 week, and the U.S.-August 22 week. On Thursday, the number of initial unemployment claims for the United States to August 23 and the revised quarterly rate of the second quarter of the United States' real GDP was revised. Then look at the monthly rate of the US July existing home signing sales index at 22:00. On Friday, we focused on the annual rate of the US core PCE price index in July at 20:30, with an expected 2.9% in this round. The previous value is 2.8%, and the monthly rate of personal spending in the United States in July and the monthly rate of core PCE price index in July. Look later at the end of the US August Chicago PMI at 21:45 and 22:00 in the US August Michigan Consumer Confidence Index and the expected end of the US August one-year inflation rate.
In terms of operation, gold: last Friday, the stop loss followed by the 3335 position reduction, and the stop loss followed by the 3325 and 3322 position reduction, and the stop loss followed by the 3335. Today's market rebounded back to 3353, the conservative 3350, the stop loss was 3346, the target was 3367 and 3379, the break was 3383 and 3392 and 3400-3412.
Silver: last Friday, the stop loss followed by the 38 position reduction, and the stop loss followed by the 38.3 position reduction, and the target was 38.5, the target was 39 and 39.3 and 39.5-39.7.
Europe and the United States: today's 1.16700, the stop loss was 1.16500, the target was 1.17000 and 1.17400 and 1.17700 and 1.18000.
U.S. crude oil: 63.3, the target is 64.7 and 65.2 and 65.7-66.
Nasdaq Index: 23310 and 23250, the target is 23420 and 23500 and 23550-23600.
The above content is all about "[XM Foreign Exchange Market Analysis]: Xiao Bao Fei Ge promotes the US Index, and gold and silver continue to be long this week". It is carefully xmhouses.compiled and edited by the editor of XM Foreign Exchange. I hope it will be helpful to your trading! Thanks for the support!
Share, it is as simple as a gust of wind that can bring refreshment, just as a flower that can bring fragranceThe fragrance is so pure. The dusty heart gradually opens up. I understand sharing. Sharing is actually so simple.
Disclaimers: XM Group only provides execution services and access permissions for online trading platforms, and allows individuals to view and/or use the website or the content provided on the website, but has no intention of making any changes or extensions, nor will it change or extend its services and access permissions. All access and usage permissions will be subject to the following terms and conditions: (i) Terms and conditions; (ii) Risk warning; And (iii) a complete disclaimer. Please note that all information provided on the website is for general informational purposes only. In addition, the content of all XM online trading platforms does not constitute, and cannot be used for any unauthorized financial market trading invitations and/or invitations. Financial market transactions pose significant risks to your investment capital.
All materials published on online trading platforms are only intended for educational/informational purposes and do not include or should be considered for financial, investment tax, or trading related consulting and advice, or transaction price records, or any financial product or non invitation related trading offers or invitations.
All content provided by XM and third-party suppliers on this website, including opinions, news, research, analysis, prices, other information, and third-party website links, remains unchanged and is provided as general market commentary rather than investment advice. All materials published on online trading platforms are only for educational/informational purposes and do not include or should be considered as applicable to financial, investment tax, or trading related advice and recommendations, or transaction price records, or any financial product or non invitation related financial offers or invitations. Please ensure that you have read and fully understood the information on XM's non independent investment research tips and risk warnings. For more details, please click here